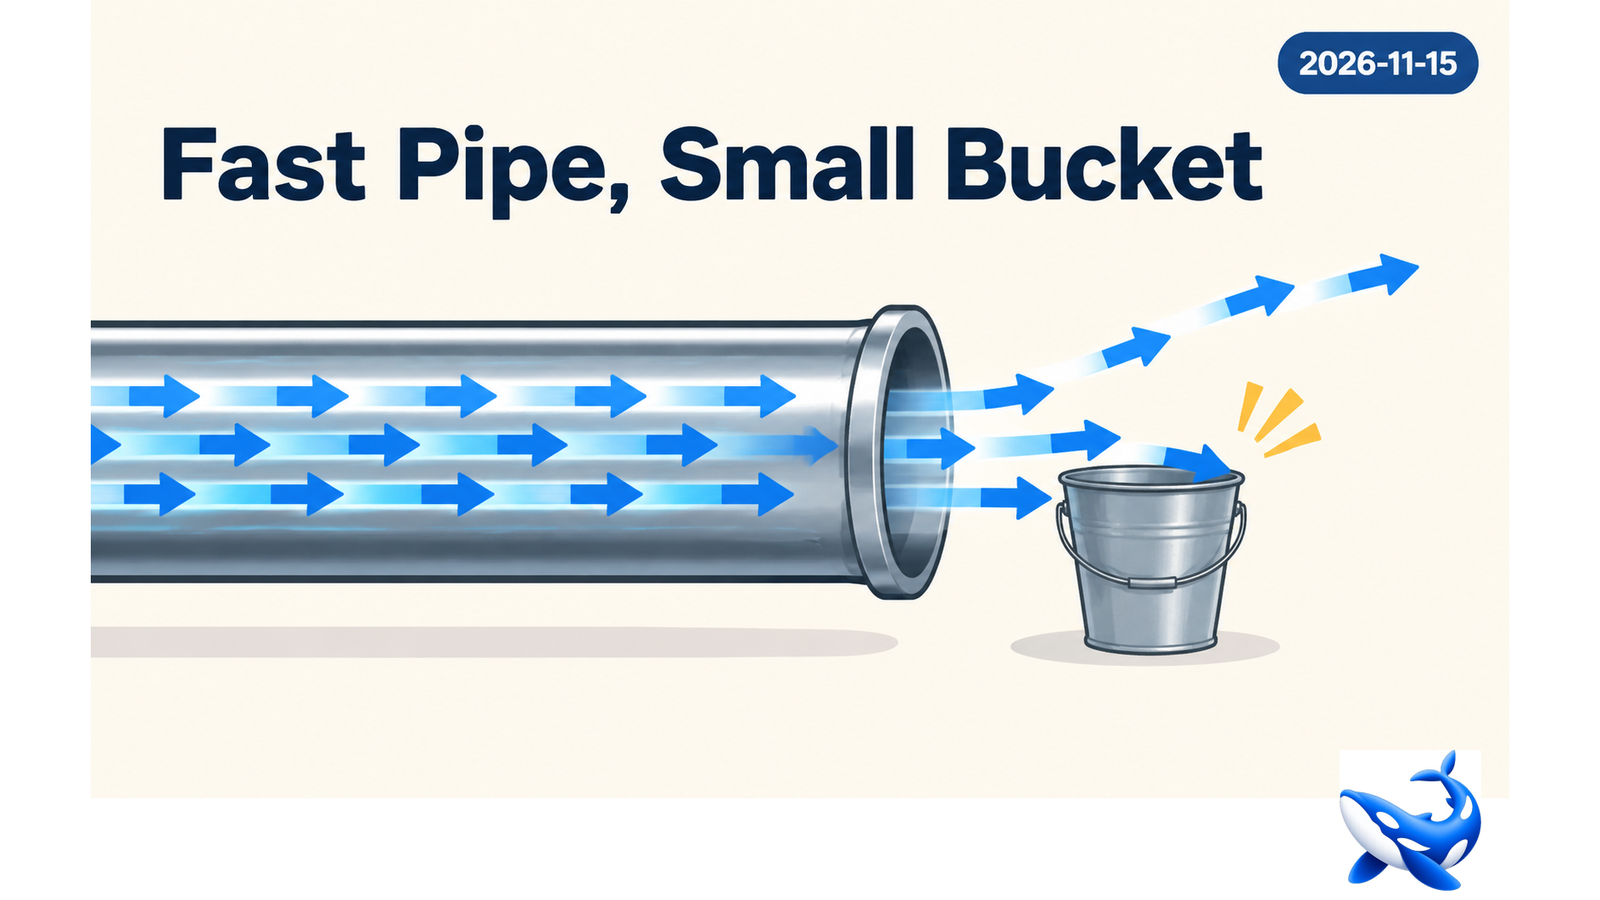
Raw rank spots can be misleading. If you see a sharp jump to spot #3 in a best group, it might look like your product works well with the market. But it could also mean you spent a lot on ads that brought in the wrong people, and they leave in two days.
A good B2C mobile plan is not about trying to jump up in the ranks fast. It is less about being deceived by those numbers and avoiding the confusion of progress on the work front with things that may seem promising in the beginning.
In order to succeed, app developers must first overcome the mindset of associating store charts with their success. They should see app store chart data as a way to check how the app is doing right now.
Why Raw Rank Spikes Deceive Growth Teams
Algorithms used in the top chart of large mobile applications take into account such factors as speed of reaction, number of downloads, and activity inside the app to identify the leaders. However, the ranking itself says nothing about whether users stick with the app or the value of a particular user.
With marketing campaigns that increase artificial indicators, ranking improves temporarily. When spending stops, the product drops because the system pulls it down.

AppsFlyer shared that worldwide spend to get new users hit $78 billion. But now, 29% of growth money goes to remarketing and keeping users, since just getting new users often means people are not active. Growth happens when you match ranks with what people do after they install the app.
Decoding Velocity, Stickiness, and Conversion Ratios
Turning market signals into money needs matching three clear numbers with chart spot:
| Metric Type | Data Point | Strategic Interpretation |
| Rank Velocity | Position delta over 6 hours | Measures real-time organic pull versus paid push. |
| Listing Conversion | Page views to downloads ratio | According to 2026 store marketing benchmarks, average conversion sits at 33.7%. Below this indicates poor creative alignment. |
| Chart Stickiness | Days sustained in Top 20 | High stickiness signals strong organic loop performance. |
Implementing a Signal Audit
- Look at hourly chart spots and see how they match up with organic search installs.
- Find where people stop on the product page after it changes.
- Check how fast your rank goes down after a promotion.
[ Hourly Rank Mapping ] ──> [ Conversion Audit ] ──> [ Post-Promo Decay Rate ]
Tying ASO Strategy to Volatility
In order to maintain brand visibility in light of competitors’ activity, store appearances have to be altered in case there are any system updates taking place.
- Keyword Optimization: Focus on mid-tail keywords in the case of high competition in the upper echelons.
- Creative Testing: Use A/B testing of app icon and preview videos in the case when you see your listing’s share of users drop in comparison to your competitors’ ones.
- Seasonal Pacing: Do updates during the periods of increased traffic in the store. Apple estimates that 850 million users visit the store on a weekly basis, providing a high probability of organic discovery for properly optimized listings, especially when leveraging app store chart data to identify top-performing keyword trends.
See also: Best Business Setup Company in Dubai: How to Choose the Right Business Partner
Calculating Organic Synergy Over Time
Paid customer acquisition should assist your application in reaching a broader audience through the mobile store, but it should not substitute organic growth. In this case, your team needs to follow the organic multiplier metric. It demonstrates how many additional organic downloads you generate compared to the number of paid downloads. The organic multiplier will show whether a higher ranking allows you to obtain a larger portion of the market. Combining the data from the app store rankings with the frequency of installation by organic customers allows you to optimize spending and remain on top of the app market category.
Accelerating Mobile Performance Through Intelligence
By analyzing how quickly your application rises through the ranks and by tracking the number of downloads and active users, one can easily translate app rankings into actionable growth strategies. Teams that adopt well-known metrics and methods for measuring their success will be able to grow effectively, outperform competitors, and maintain their leadership position in the market.